|
Equipment Damage Curves Generators |
||||||||||||||||||||||||||||||||||||||||||||||||||||||||||||||||||||||||||
| The information presented in this
application guide is for review, approval, interpretation and
application by a registered professional engineer only. SKM
disclaims any responsibility and liability resulting from the
use and interpretation of this information. Reproduction of this material is permitted provided proper acknowledgement is given to SKM Systems Analysis Inc. Purpose The purpose of this guide is to provide basic information about generator thermal limit curves and characteristic landmarks necessary for plotting on time-current curves, for the purpose of equipment overcurrent protection. Full Load Amps (FLA) Rated continuous current carrying capacity of a motor at a referenced ambient temperature and allowable temperature rise, see table 1. |
||||||||||||||||||||||||||||||||||||||||||||||||||||||||||||||||||||||||||
| Table 1 Generator Temperature Ratings | ||||||||||||||||||||||||||||||||||||||||||||||||||||||||||||||||||||||||||
|
||||||||||||||||||||||||||||||||||||||||||||||||||||||||||||||||||||||||||
| Short-Time
Thermal (Overload) Capability Curve The short time thermal capability or overload curve represents the permissible output capability under emergency conditions. This curve is not meant as an indication of continuous overload capability, and should never be used to schedule running overload operations. Repeated operation up to and beyond the running overload curve will reduce insulation life. The short-time thermal capability of cylindrical rotor generators as defined in ANSI C37.50 is listed in Table 2. |
||||||||||||||||||||||||||||||||||||||||||||||||||||||||||||||||||||||||||
| Table 2 Shot-time thermal capability | ||||||||||||||||||||||||||||||||||||||||||||||||||||||||||||||||||||||||||
|
||||||||||||||||||||||||||||||||||||||||||||||||||||||||||||||||||||||||||
| Short Circuit Withstand Capability Point | ||||||||||||||||||||||||||||||||||||||||||||||||||||||||||||||||||||||||||
| The short circuit withstand capability point
represents the maximum time the machine can withstand a 3-φ short circuit at its terminals without
damage when operating at rated kVA and power factor, at 5
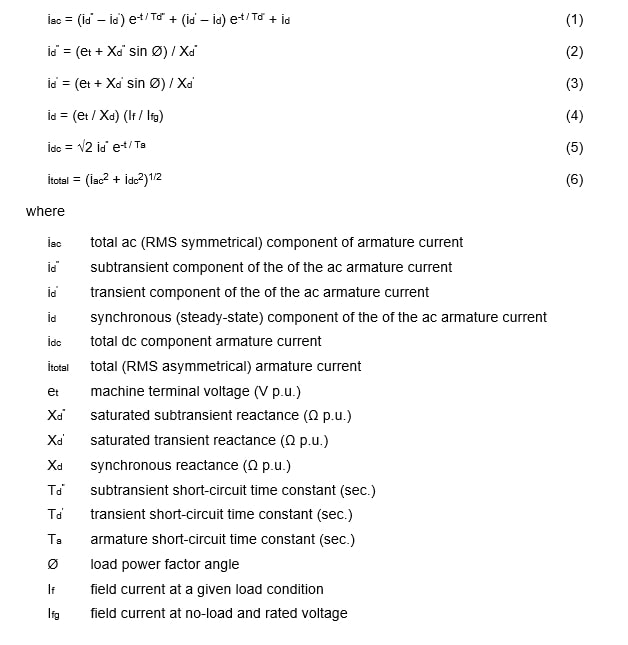
percent over-voltage, with field excitation. Decrement Curve The decrement curve represents the current output of the machine considering a 3-φ fault applied at or near its terminals. The current output is defined by the following equations. |
||||||||||||||||||||||||||||||||||||||||||||||||||||||||||||||||||||||||||
 |
||||||||||||||||||||||||||||||||||||||||||||||||||||||||||||||||||||||||||
| Example
Plot the characteristic landmarks for a 750kVA, 480V, 902A synchronous generator with the following characteristics. Xd" = 0.107 Ω p.u., Xd' = 0.154 Ω p.u., Xd = 0.93 Ω p.u. Td" = 0.015 sec., Td' = 0.417 sec., Ta = 0.189 sec. If = 3 A p.u., Ifg = 1 A p.u. Solution In the submittal package from the generator manufacturer the overload capability at rated operating (hot) temperature is listed as |
||||||||||||||||||||||||||||||||||||||||||||||||||||||||||||||||||||||||||
|
||||||||||||||||||||||||||||||||||||||||||||||||||||||||||||||||||||||||||
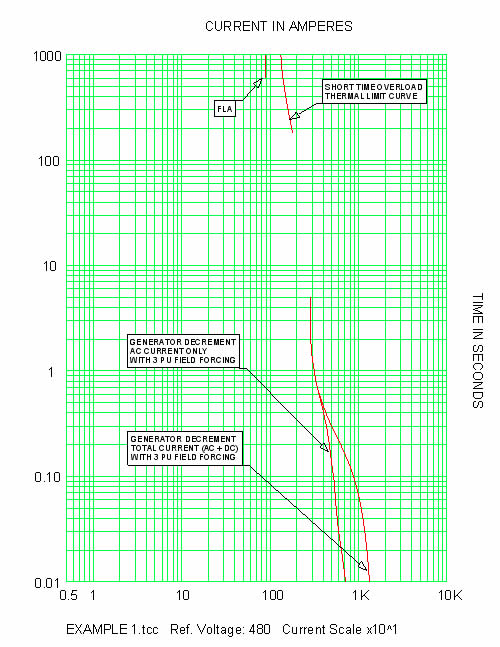
| The manufacturer also lists a sustained short circuit capability of 300% line current for 5 seconds. The decrement curve will be calculated using equation (1) from 0.01 to 5 seconds. | ||||||||||||||||||||||||||||||||||||||||||||||||||||||||||||||||||||||||||
|
||||||||||||||||||||||||||||||||||||||||||||||||||||||||||||||||||||||||||
| The results are plotted in figure 1. | ||||||||||||||||||||||||||||||||||||||||||||||||||||||||||||||||||||||||||
 |
||||||||||||||||||||||||||||||||||||||||||||||||||||||||||||||||||||||||||
| Fig. 1 750kVA generator damage curves | ||||||||||||||||||||||||||||||||||||||||||||||||||||||||||||||||||||||||||
| References | ||||||||||||||||||||||||||||||||||||||||||||||||||||||||||||||||||||||||||
| •
Other Application Guides offered by SKM Systems Analysis at
www.skm.com • Electrical Transmission and Distribution Reference Book, ABB Power T&D Company, Raleigh, North Carolina, 1997 • Protective Relaying Theory and Applications, 2nd Edition, Marcel Dekker, New York, 2004 |
||||||||||||||||||||||||||||||||||||||||||||||||||||||||||||||||||||||||||
| The latest revision of: | ||||||||||||||||||||||||||||||||||||||||||||||||||||||||||||||||||||||||||
| •
IEEE Std 242, IEEE Recommended Practice for Protection and
Coordination of Industrial and Commercial Power Systems (IEEE
Buff Book) • IEEE Std C37.102, IEEE Guide for AC Generator Protection • IEEE Std C37.101, IEEE Guide for Generator Ground Protection • ANSI C50.13, Cylindrical-Rotor Synchronous Generators • NEMA MG-1, Motors and Generators |
||||||||||||||||||||||||||||||||||||||||||||||||||||||||||||||||||||||||||
| Insulating Materials | ||||||||||||||||||||||||||||||||||||||||||||||||||||||||||||||||||||||||||
|
||||||||||||||||||||||||||||||||||||||||||||||||||||||||||||||||||||||||||
| back to Application guides | ||||||||||||||||||||||||||||||||||||||||||||||||||||||||||||||||||||||||||